

Running a Shopify store means constantly juggling inventory, racing to restock bestsellers while slow-moving products pile up. It’s frustrating, expensive, and all too familiar.
But what if you had a predictive system to decide what to reorder first, what to discount, and what to stop stocking altogether? That’s exactly what ABC analysis does.
Instead of treating every product the same, it ranks inventory by its impact on your revenue, helping you focus on what actually moves the needle.
With a smarter approach to stock management, you’ll spend less time firefighting and more time growing your store. Let’s break down the Shopify ABC Product analysis step by step.
What is ABC Product Analysis for Shopify?
ABC product analysis is a way to rank and reorder your inventory by importance. It sorts products into three categories (A, B, C) based on how much they contribute to your revenue.
Think of it like a restaurant menu. Some dishes are customer favorites, always in demand. Others sell steadily but aren’t the stars. Here’s how stock is typically categorized using ABC analysis.
- Class A: The top 20% of products that generate around 80% of total revenue
- Class B: The next 30% of products, contributing approximately 15% of revenue
- Class C: The bottom 50% of products, accounting for around 5% of revenue
The table below breaks down the stock categorization of a Shopify store using ABC analysis and shows how you can manage each class of product.
Key Benefits of Shopify ABC Product Analysis
Before you learn how to conduct an ABC analysis, let’s understand some of the benefits an ABC analysis brings to your store.
1. Improved inventory turnover rates
10.86. This is the inventory turnover ratio benchmark for retailers. In simple terms, it means they sell and restock their entire inventory more than 10 times a year, keeping cash flow steady and products moving.
A low inventory turnover means capital is stuck in unsold stock, driving up storage costs and increasing the risk of dead stock due to ever-changing trends. But businesses that use ABC analysis to adjust their inventory can cut excess stock, ensuring bestsellers stay in stock while slow movers don’t drain resources.
Poor inventory management ties up money that could be spent on growth, marketing, or new product lines. A smarter, simpler approach leads to better cash flow, lower costs, and fewer deadstock headaches, giving your Shopify store the flexibility to scale.
2. Data-driven demand forecasting and stock optimization
No more guesswork. ABC analysis brings clarity to demand forecasting.
By ranking products based on their revenue impact, Shopify stores can focus on bestsellers while preventing slow-moving stock from piling up. Class A products? Always in stock. Class C? Managed carefully to avoid dead inventory.
Stockouts mean lost sales while overstocking ties up cash that could be used elsewhere. With precise forecasting, businesses can adjust purchasing decisions, align inventory with demand trends, and reduce carrying costs.
In short, having the right stock at the right time leads to happier customers, lower costs, and a stronger bottom line.
3. Cost savings through strategic purchasing decisions
Inventory distortion due to both overstocks and out-of-stocks costs retailers $1.77 trillion worldwide in 2023.
Overstocking low-value, i.e., Class C products, increases the storage costs, freezes cash flow, and reduces your profits due to markdowns.
Prioritizing Class A items allows Shopify stores to negotiate better supplier terms by placing bulk and consistent orders, leading to lower procurement costs and higher efficiency.
4. Smarter business decisions
While ABC analysis is important for making purchases, it also helps inform other business decisions, including storage, promotion, pricing, etc.
For example, Class A products should be featured in high-visibility promotions, ad campaigns, and bundles to maximize revenue, while Class B items may benefit from strategic discounting or upselling. Meanwhile, Class C products (low-value, slow-moving inventory) can be cleared through seasonal sales, bulk discounts, or even phased out entirely to free up capital.
Beyond sales, warehouse organization and logistics also improve. High-priority Class A items can be stored in easily accessible locations for faster fulfillment, reducing handling time and improving operational efficiency.
Step-by-Step Guide to Doing Shopify ABC analysis by Product
Now that you get the impact of ABC analysis, here’s a step-by-step guide to conducting your own analysis that gets easier with tools like Prediko.
Step 1: Gather data
To do any kind of analysis, you need data points. The goal here is to have a comprehensive view of inventory items and their financial impact.
Start by creating a complete list of every product or SKU in stock. This ensures no item is overlooked and provides a clear starting point for ABC analysis. Next, gather data on how many units of each item were sold over a relevant period, annually, quarterly, or monthly, depending on your business model.
Use historical sales data, production records, or demand forecasts to track trends and predict future demand. Lastly, record the cost per unit for every product. This helps assess financial significance and ensures that stock decisions are based on profitability and impact.
Remember, ABC analysis isn't just for finished goods; the same approach can be applied to raw materials used in production.
If you’re relying on spreadsheets like a Shopify product ABC analysis template, things can get tricky pretty fast. Tools like Prediko give you real-time and centralized visibility across sales history, purchase orders, and stock levels, reducing the risk of human error and making your ABC analysis less time-consuming.
Step 2: Calculate the annual consumption value
Now that you have the data, it's time to calculate the annual consumption value for each item. This is simply the annual consumption (demand) multiplied by the unit cost.
Annual Consumption Value = Annual Demand (quantity) × Unit Cost (cost to company)
Let’s say you run a Shopify store selling coffee equipment. Here’s how the numbers might look for three products.
Step 3: Classify items into categories (A, B, and C)
Now that you have a list of products ready, it’s time to classify them
- Sort by Annual Consumption Value: Arrange your product list in descending order of total value. The highest-value items appear at the top, and the lowest at the bottom.
- Calculate the cumulative percentage of total inventory value: Find each item’s percentage contribution to the total inventory value. Add these percentages cumulatively down the list.
- Set cutoff points for A, B, and C classes
- Class A: Items that cumulatively account for ~80% of total sales value (usually the top 20% of items).
- Class B: Items that contribute to the next ~15% of total sales value (typically 30% of items).
- Class C: The remaining items that make up only ~5% of total sales value (often 50% of items).
Here’s a Shopify product ABC analysis example table of a store selling health & wellness products
If you’re using Prediko, you can automate this tedious process. The app analyzes not just historical data but also predicts data to identify trends and patterns and suggest optimal classification points for your A, B, and C categories.
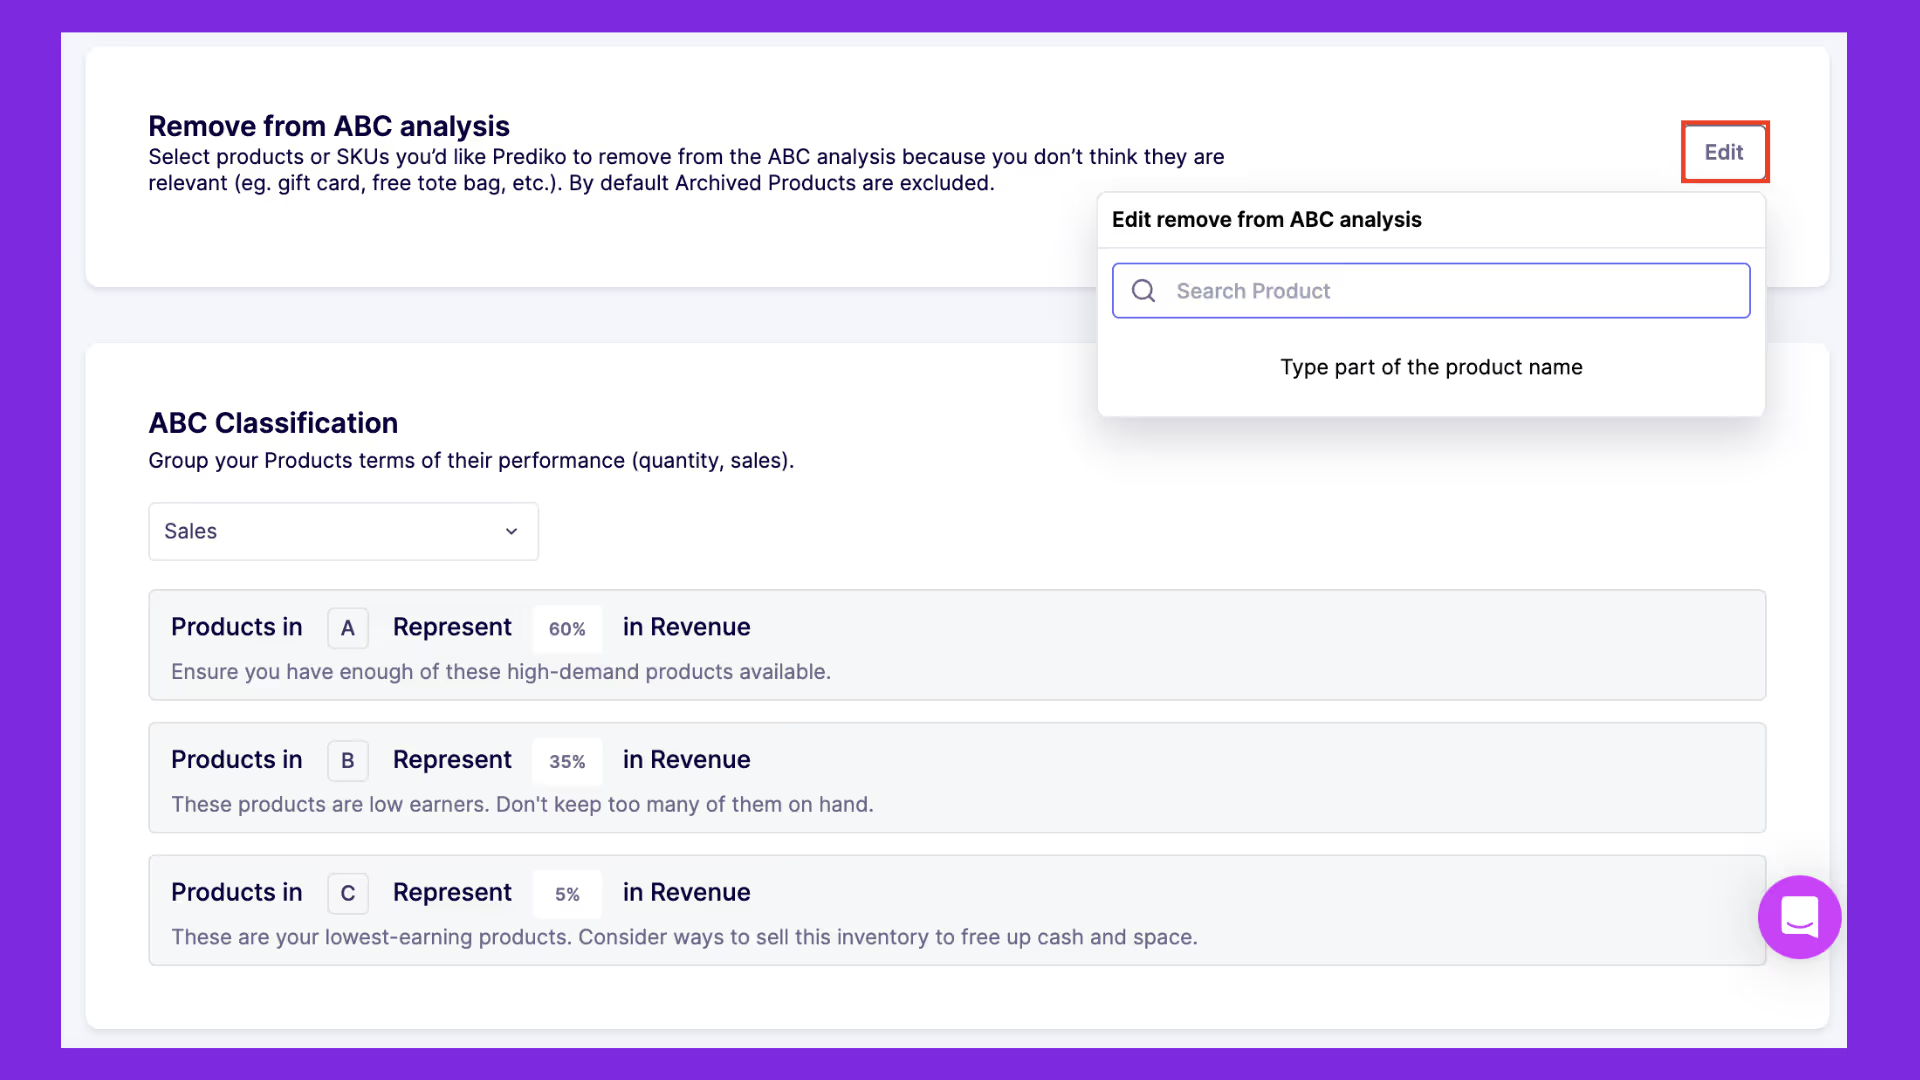
For growing wellness brands, AI-powered Shopify inventory forecasting for health, wellness, and fitness stores helps predict demand, prevent stockouts, and align inventory with sales goals.
Step 4: Analyze and apply the results
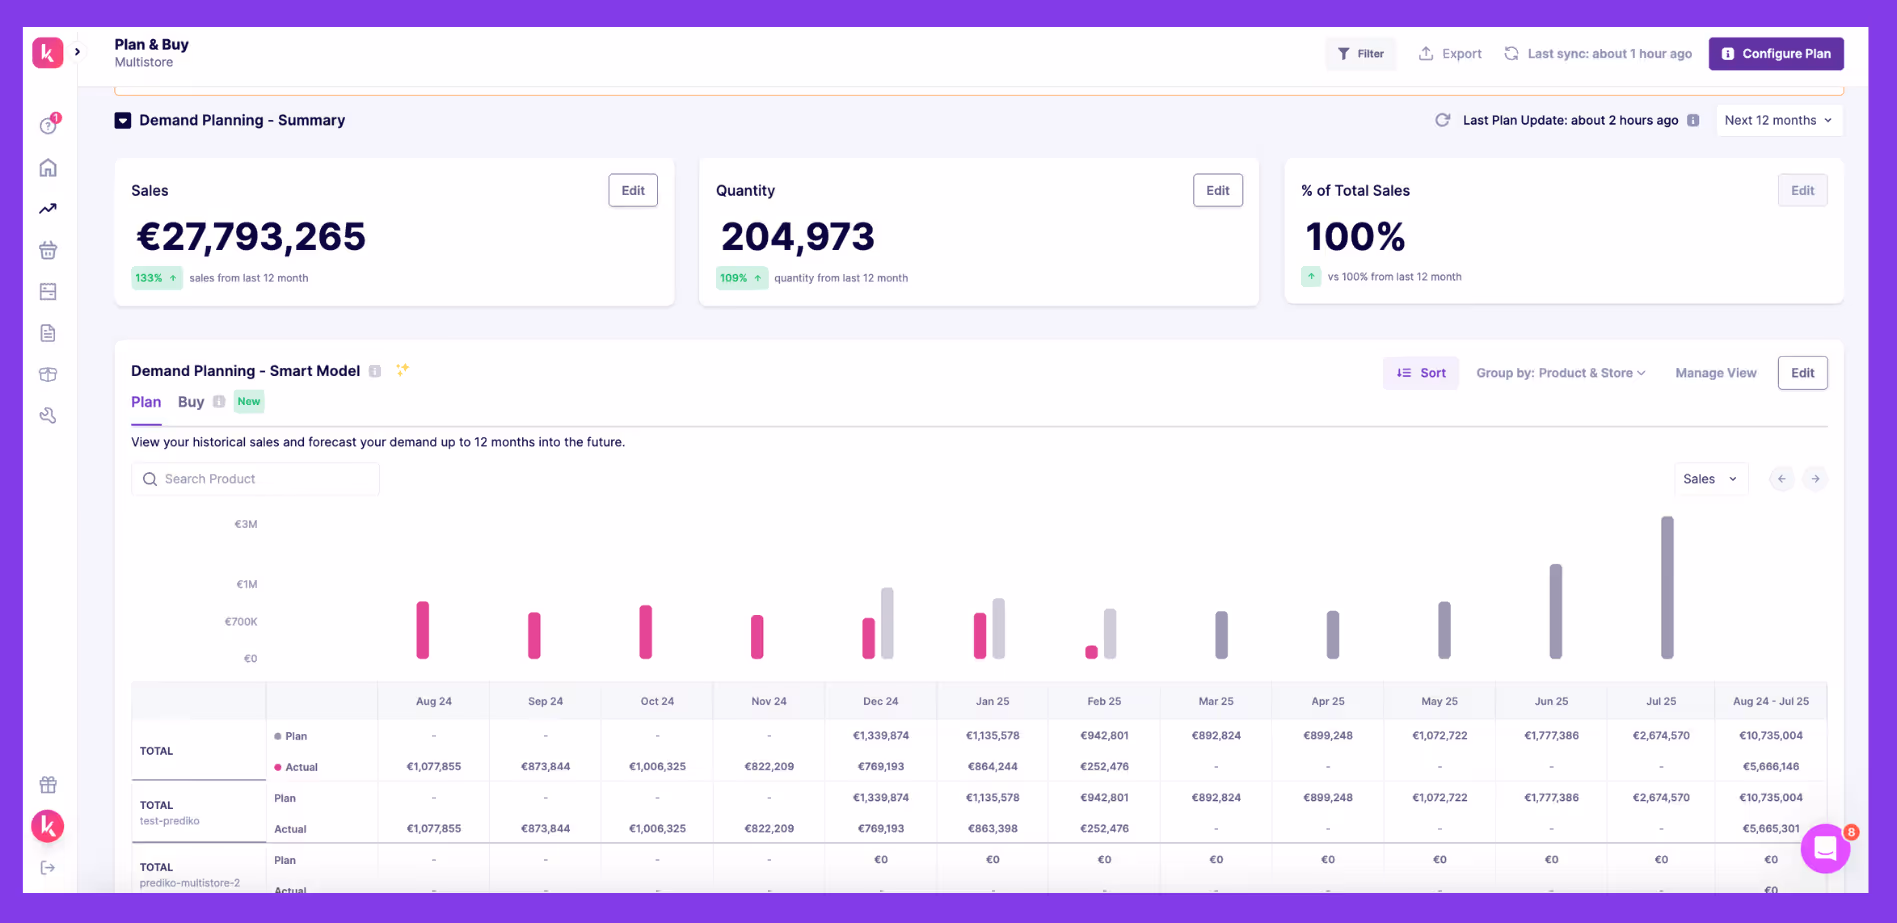
Now that the analysis is complete, use the insights to make smarter business decisions, including inventory restocking, marketing, pricing, promotions, and storage optimization.
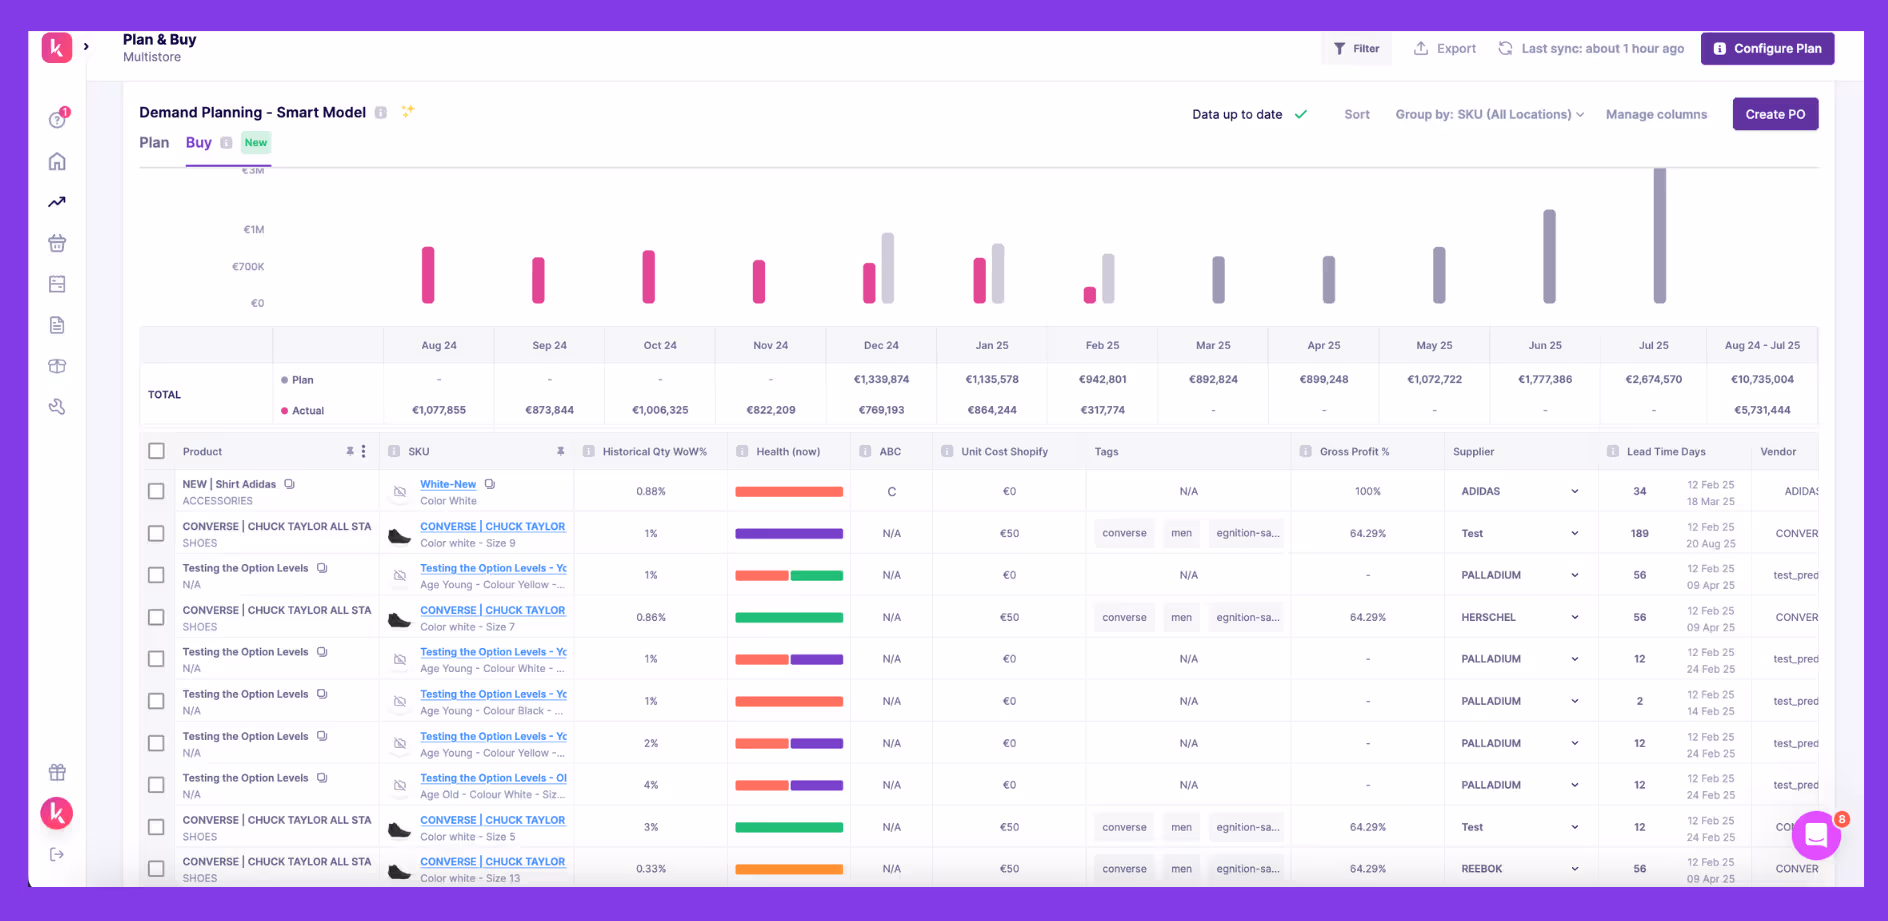
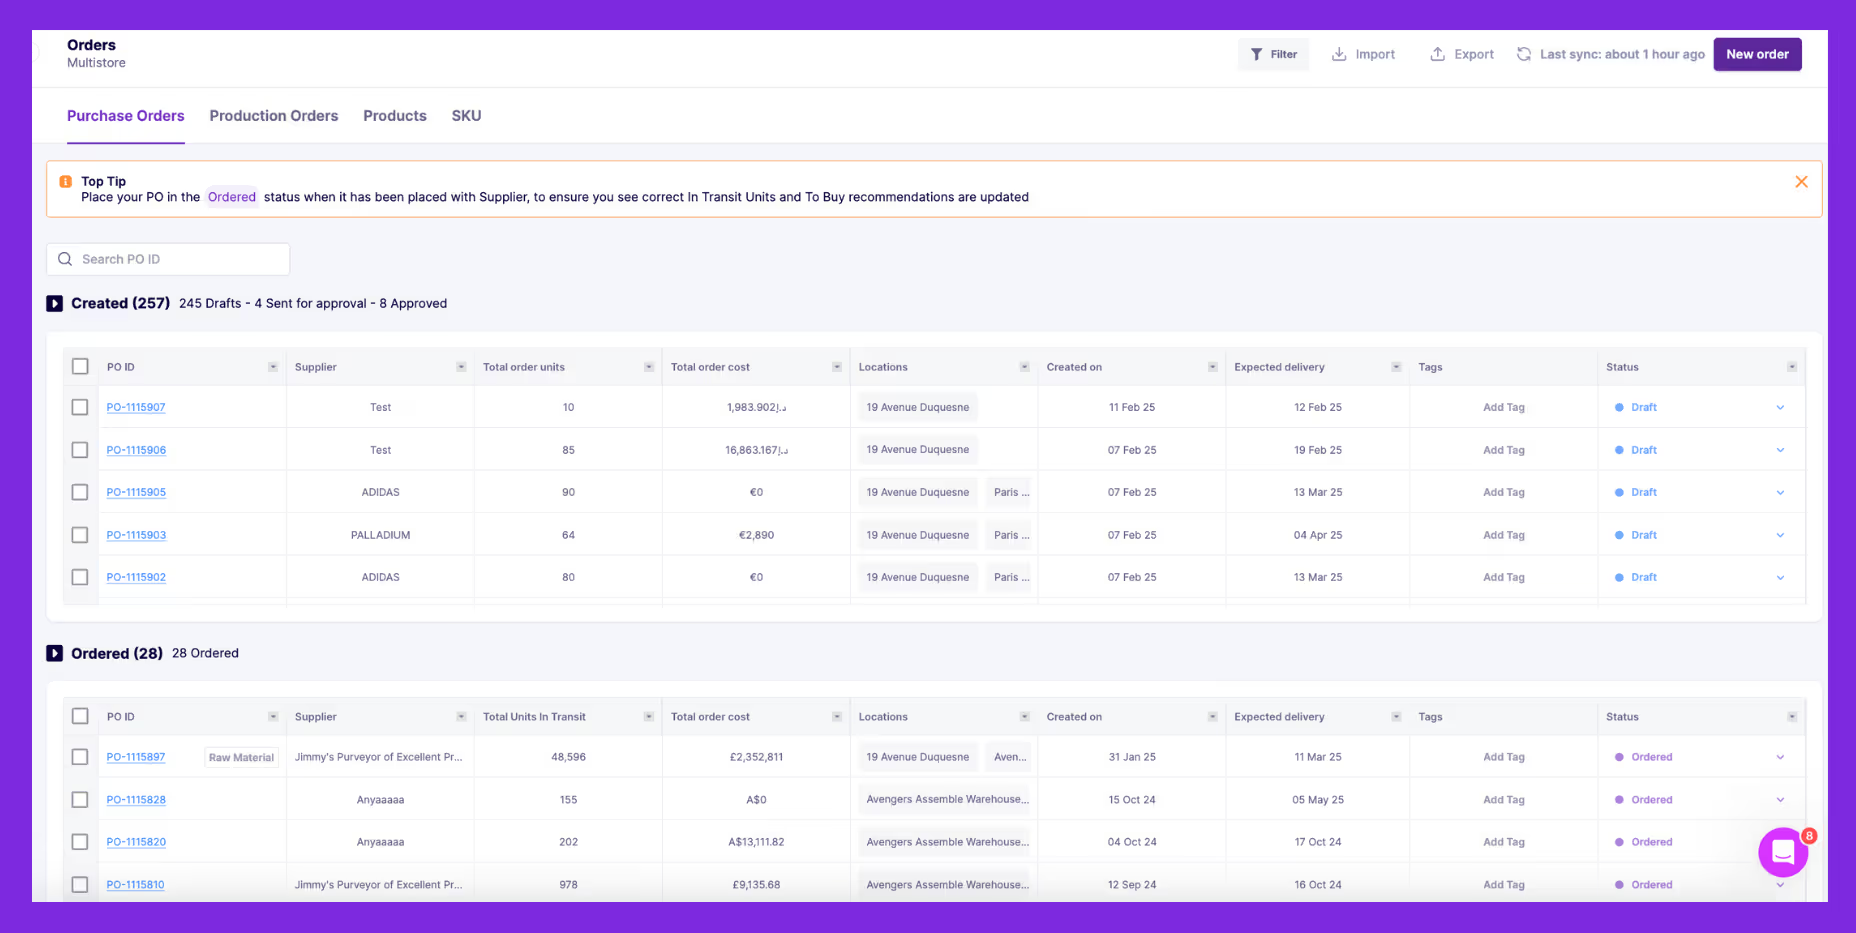
With Prediko’s Buying Table, you get data-backed suggestions to make educated decisions on when to restock, which products to promote, and how to allocate storage space efficiently.
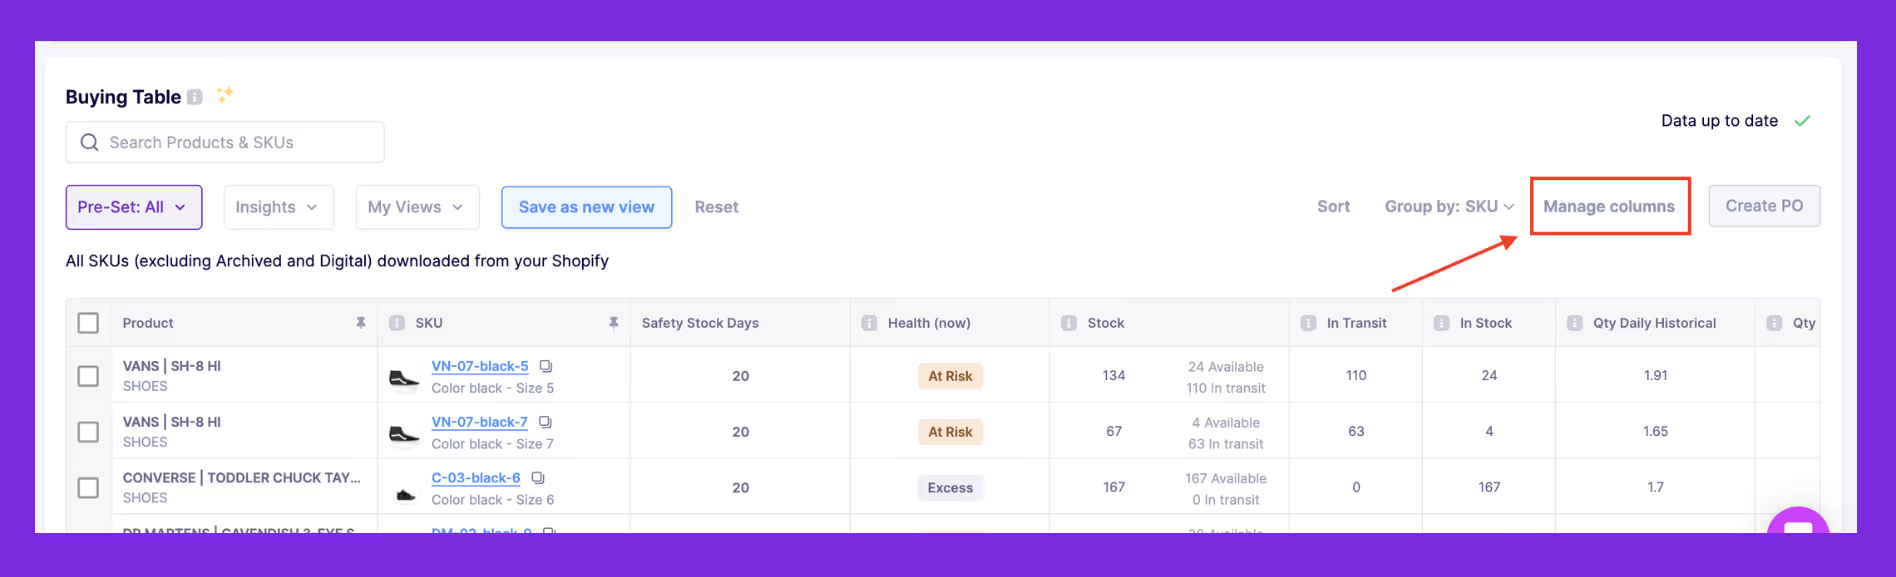
- Class A: These are the most profitable products and need to always be in stock. In Prediko, filter by Class A and check the recommended order quantity to ensure these items never run out. If lead times are long, set reorder triggers earlier
- Class B: These contribute moderately to revenue, so stock levels should be adjusted based on trends. Use another column to check how long the current stock will last, and reorder only if demand justifies it
- Class C: These products take up space and generate low revenue. Filter for Class C and check if any items have high excess stock. Reduce or pause reorders unless they are seasonal or have a steady demand
This way, you can adjust purchase plans, marketing strategies, pricing, and promotional strategies in a way that money is spent on the right products while avoiding excess inventory.
Top 5 Apps to Conduct Accurate Shopify ABC Analysis
While an ABC analysis can be done manually, the right tools can automate data collection and forecasting and expedite purchasing decisions.
Here are the five best apps available on the Shopify Store to conduct ABC analysis for your business.
1. Prediko
TL;DR: Automates ABC and PO creation for Shopify.
Prediko is an AI-powered inventory planning and management app built especially for Shopify merchants who want smarter stock management and to eliminate guesswork. Its carefully designed features help you prevent overstocking of the wrong product or running out of bestsellers.
Key features
- AI Demand Planning: The app predicts demand by analyzing past sales, seasonality, and market trends, ensuring A-class products never run out while adjusting B and C stock
- Buying Table: Get real-time purchase suggestions based on sales velocity, stock levels, and lead times, so you know exactly when and how much to reorder
- Purchase Order Management: Create details for Class A, B, and C in a click and send them to the suppliers right from the app. Sync the received stock automatically in Shopify, reducing manual workload
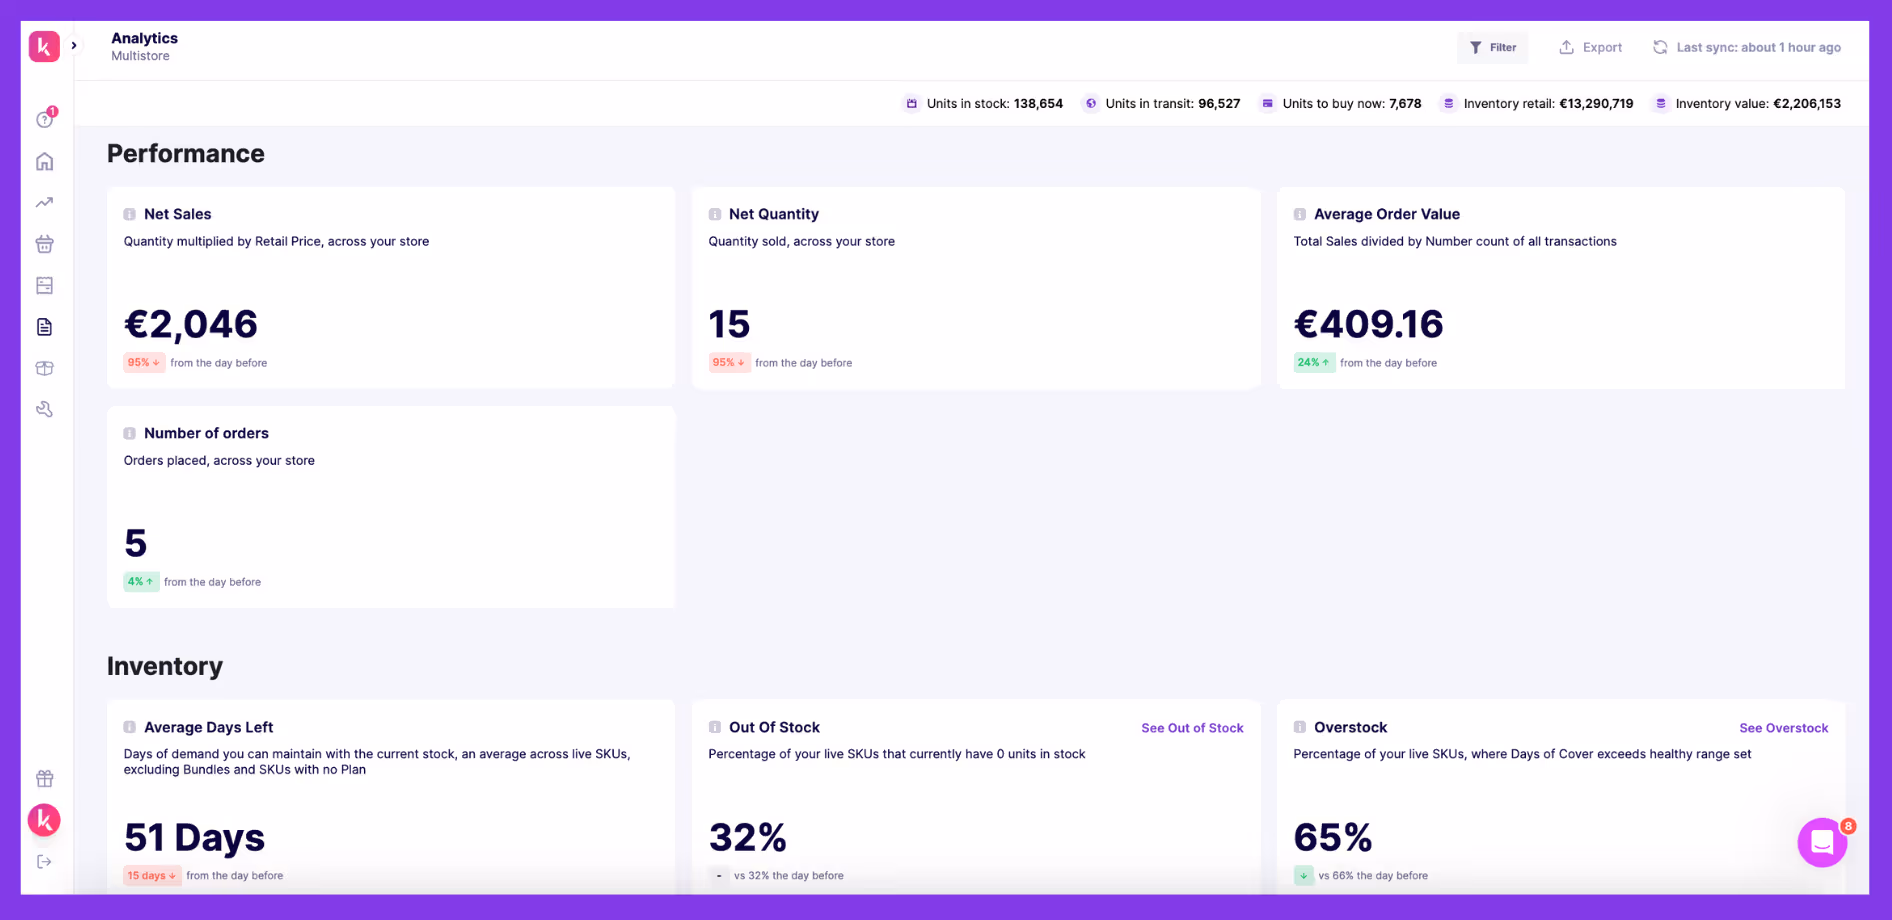
- Insights & Analytics – Get real-time data on inventory performance, top-selling products, overdue POs, stock excess, and sales plan achievement to make educated decisions
Pricing
Prediko’s pricing scales with the revenue of your Shopify store. Plans start from $49/month (billed annually)
2. Bee Forecast & Replenishment
TL;DR: Simplifies forecasting and restocking with outlier filtering.

Bee Forecast & Replenishment is a Shopify app that helps merchants with ABC analysis and daily inventory operations. It provides detailed reports and automatically calculates the necessary stock replenishment levels to avoid stockouts while minimizing overstocking.
Key features
- Uses historical sales data to categorize the products
- Restocking suggestions based on categories
- Identifies and excludes outlier sales to prevent overstocking based on unusual spikes
- Gives you the ability to customize the reports and analytics
Pricing
The Basic Plan costs $24.99/month. They also offer a Free Plan for up to 100 SKUs with basic forecasting and reports.
3. NetSuite Oracle
TL;DR: Handles ABC logic and multi-location stock for enterprises.

NetSuite Oracle is an inventory management tool that helps Shopify merchants track and organize their inventory. It comes with built-in ABC analysis, which automatically sorts inventory based on value and usage.
Key features
- Automatic ABC classification to identify the most important inventory
- Multi-location inventory tracking for warehouses, stores, and fulfillment centers
- Replenishment alerts based on historical and seasonal sales data, average lead time, and number of inventory days
Pricing
You’ll have to contact their team to know the pricing.
4. Cin7
TL;DR: Streamlines classification, replenishment, and multi-warehouse visibility.

Cin7 is another inventory management system designed for retailers, wholesalers, and e-commerce businesses. It comes with built-in ABC analysis, helping Shopify sellers categorize inventory efficiently and focus on their most valuable products.
Key features
- Auto-calculates ABC classifications based on sales data and other relevant factors
- Automated reminders to keep inventory levels in line with demand
- Multi-location inventory tracking for warehouses, stores, and fulfilment centers
Pricing
Cin7 pricing starts at $349 per month and goes up to $999 per month.
For a more modern solution that’s easier to implement and scale on Shopify, explore these Cin7 alternatives for growing Shopify brands.
5. Zoho Inventory
TL;DR: Budget-friendly tool with customizable ABC filters and reports.
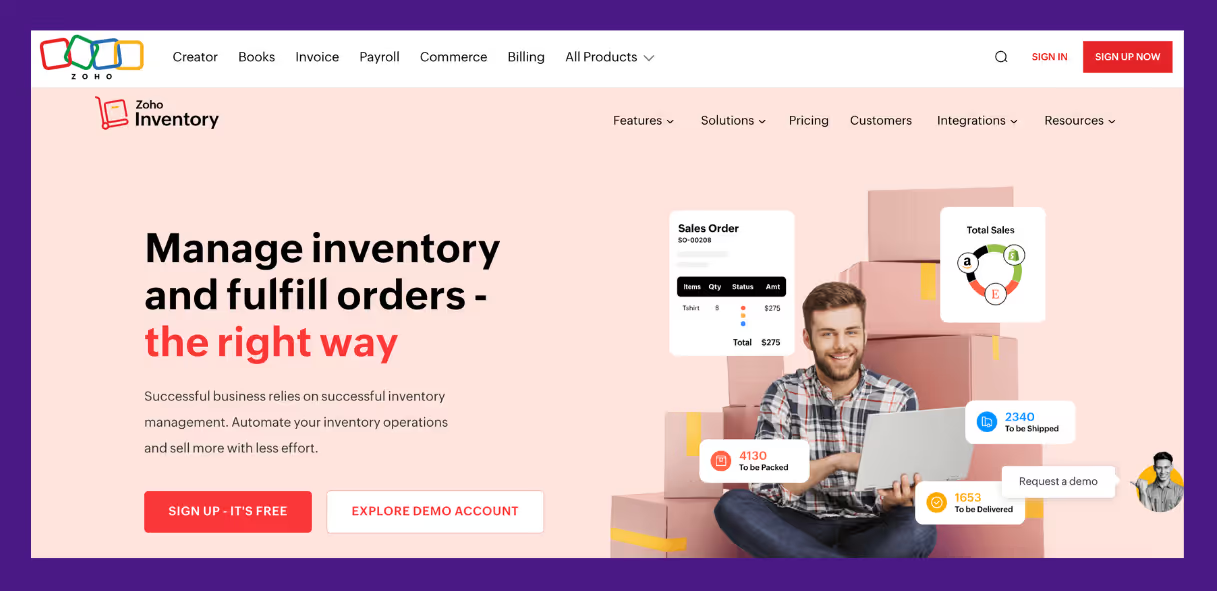
Zoho Inventory is an inventory management system that offers built-in ABC analysis, reorder alerts, and barcode scanning and integrates with Zoho’s business suite, including Zoho Books (accounting), Zoho CRM (customer management), and Zoho Analytics (reporting).
Key features
- ABC report that groups items based on the revenue they generate
- Shows communicative value and share in the total revenue generated by each product
- Customizable percentage limit for each class using filters and a date range
- Ability to export the ABC classification report
Pricing
Zoho’s Inventory Management pricing starts at $29 per month and goes up to $249 per month.
Automate Shopify ABC analysis using Prediko
ABC analysis helps segment inventory into three categories –A (high-value, low stock), B (moderate value, balanced stock), and C (low-value, excess stock) products. This helps businesses
- Keep bestsellers stocked and reduce excess inventory
- Align stock with demand trends to cut costs
- Improve the efficiency of forecasting, promotions, and storage
Tools like Prediko make it easy to do ABC analysis and forecast demand, eliminating the time-consuming and error-prone manual approach. Built for Shopify brands, Prediko also automates real-time stock tracking, PO generation, and replenishment. This translates into reduced stockouts and overstocks and improved cash flow, setting your business on an upward trajectory.
Start a free 14-day trial with Prediko and see how it expedites ABC analysis, saving you time for other business aspects.