


What is Inventory Turnover - A Quick Explanation
Inventory turnover measures how often a Shopify D2C brand sells and replaces its stock within a given period. It is a critical efficiency metric that helps D2C brands assess their sales and inventory management effectiveness.
Steps to Calculate Inventory Turnover for D2C Brands
Efficient inventory turnover is crucial for D2C brands to ensure cash flow, minimize holding costs, and avoid overstocking or understocking.
Determine Cost of Goods Sold (COGS)
Definition: Cost of Goods Sold (COGS) represents the direct costs associated with producing or purchasing the products sold by your brand during a given period.
Calculation Formula: COGS = Beginning Inventory + Purchases During the Period - Ending Inventory
Why Accurate COGS Matters:
- Precise COGS values ensure you are calculating turnover with a true reflection of your expenses.
- Incorrect COGS can distort your inventory turnover ratio, impacting decision-making around inventory management, pricing, and purchasing.
Example: If your starting inventory was $20,000, purchases during the period were $15,000, and your ending inventory was $10,000:
COGS = $20,000 + $15,000 - $10,000 = $25,000
Calculate Average Inventory
Definition: Average inventory is the mean value of your inventory during the accounting period, smoothing out fluctuations in stock levels.
Calculation Formula: Average Inventory = (Beginning Inventory + Ending Inventory) / 2
Why Accurate Average Inventory Matters:
- Average inventory reflects seasonal changes and temporary inventory spikes, providing a more accurate turnover calculation.
- A consistently updated inventory value ensures accurate reporting.
Example: If your beginning inventory is $20,000 and ending inventory is $10,000:
Average Inventory = ($20,000 + $10,000) / 2 = $15,000
Apply the Inventory Turnover Formula
The inventory turnover ratio is calculated using this formula:
Inventory Turnover = COGS / Average Inventory
Step-by-Step Example:
- Calculate COGS = $25,000
- Calculate Average Inventory = $15,000
- Apply the formula: Inventory Turnover = $25,000 / $15,000 = 1.67
What This Means:
- A turnover rate of 1.67 indicates your inventory cycles through approximately 1.67 times during the defined period.
- Lower values may indicate overstocking, while higher values suggest effective stock movement but could also imply stockouts.
Benchmarking Inventory Turnover
Benchmarking inventory turnover helps you understand how your D2C brand compares to industry standards and competitors.
Understanding Industry Benchmarks for D2C Brands
- Fashion and apparel brands may have higher turnover rates due to fast-moving trends, typically ranging between 3-6.
- Home goods or specialty stores may experience slower turnover rates, averaging between 1-3.
- Fast-moving consumer goods (FMCG) brands often maintain turnover rates above 10.
How LIFO impacts inventory turnover and cost of goods sold.
Using Benchmarking Tools
To compare your turnover effectively:
- Utilize tools like Prediko to track your inventory performance.
- Platforms like Shopify Analytics can also help identify sales trends and inventory movement patterns.
In addition to calculating inventory turnover, learn how to calculate days inventory outstanding for a holistic analysis.
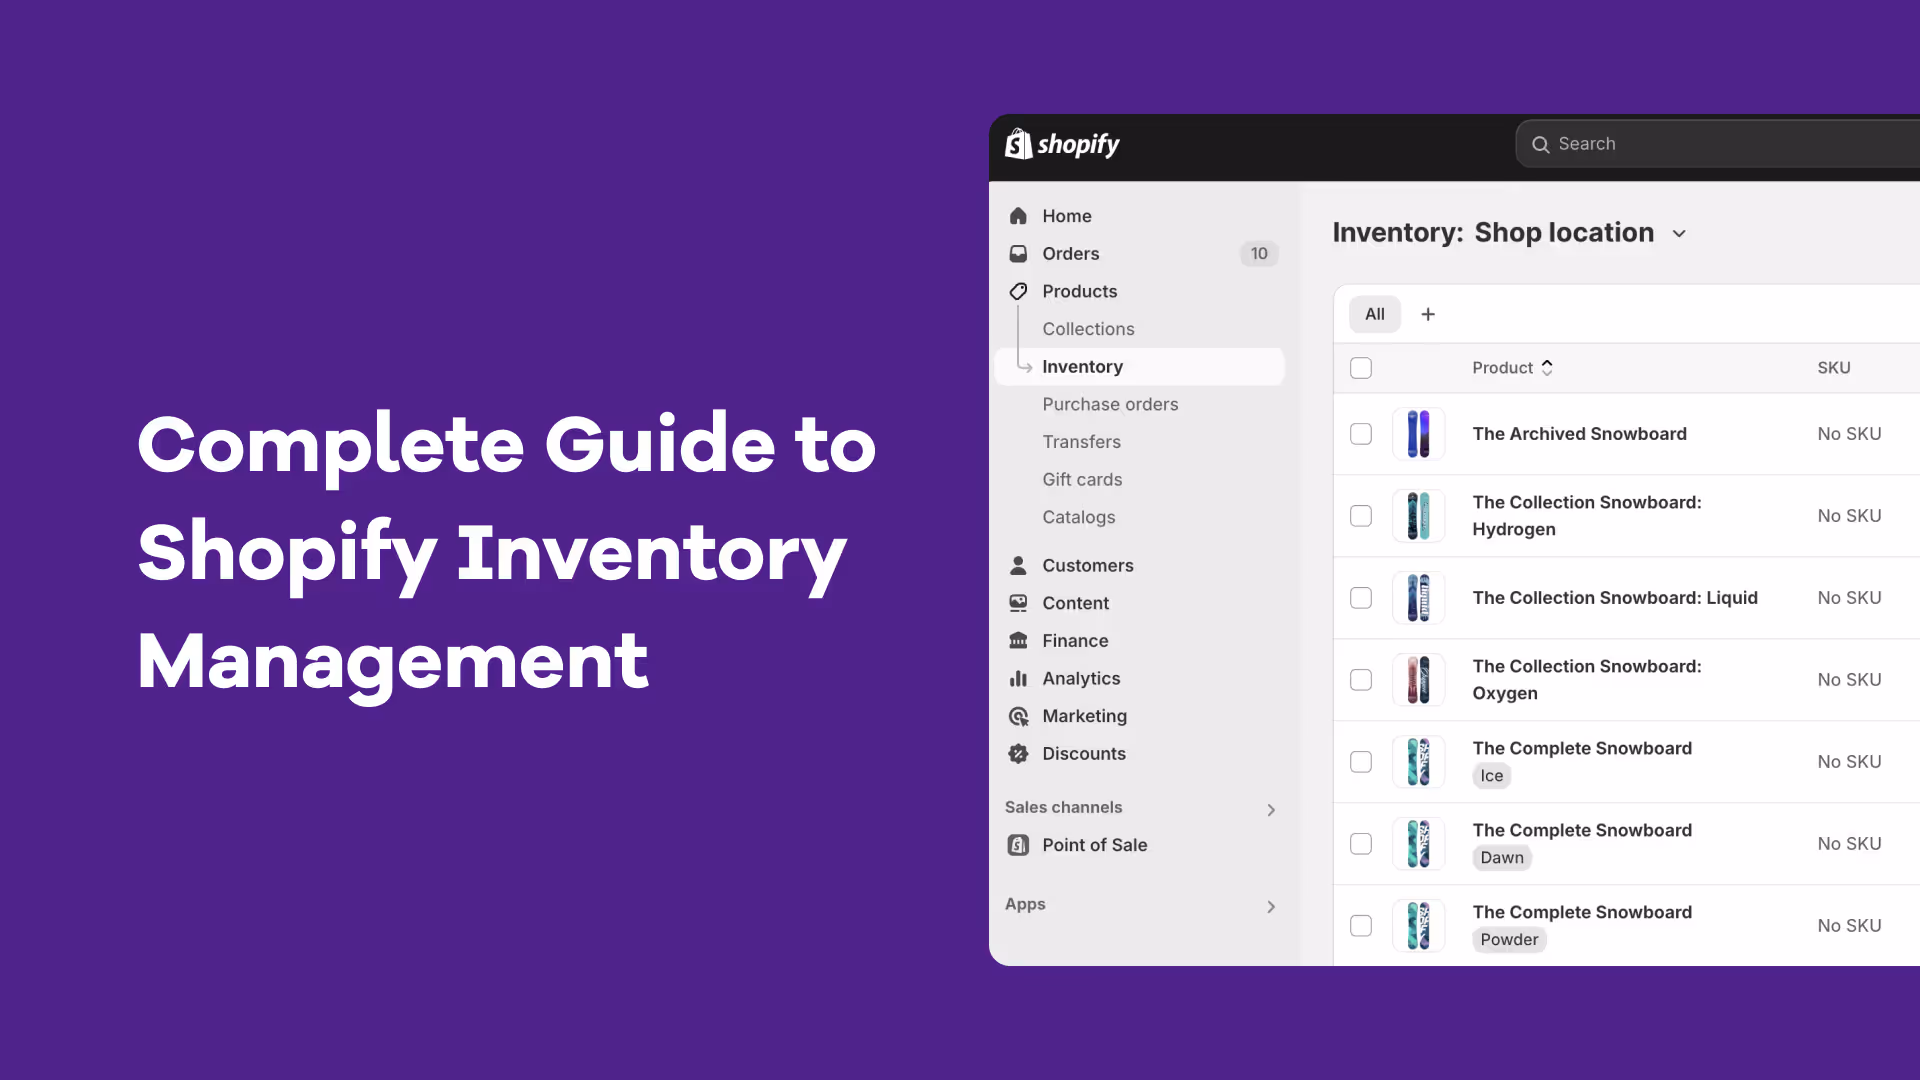
How to create reports for Inventory Turnover Ratio using Shopify?
Shopify doesn’t track historical inventory data directly, which complicates calculating inventory turnover. This is because:
1. Lack of Historical Stock Snapshots – Shopify only tracks current inventory levels, not past ones.
2. Custom Solutions Required – Users often need to manually export inventory data daily (using Shopify API) and store it in external platforms like SQL or Google Sheets.
3. Third-Party Apps – Tools like Prediko and Polar Analytics offer better historical inventory tracking and reporting.
Using Prediko to Calculate and Manage Inventory Turnover
Prediko offers a simple and straightforward way of calculating and managing Inventory Turnover. The Prediko Buying Table gives you live recommendations on what products to reorder and has customisable columns that give you easy access to the information you need to calculate your inventory turnover
.avif)
Prediko makes your COGS values easily accessible within the buying table and allows you to easily extract average inventory reports to calculate your inventory turnover. By having easy access to this information you are set up to succeed in improving your inventory turnover.
.avif)
Analysing the Value for Inventory Turnover
1. High Inventory Turnover
This indicates that the brand is selling its inventory quickly and suggests strong sales and/or effective inventory management. High turnover can be advantageous because it suggests there is little obsolete inventory, reducing storage and insurance costs.
2. Low Inventory Turnover
This means that inventory is selling more slowly. This can be a concern as it may indicate poor sales performance, overstocking, or obsolescence. Low turnover can lead to higher storage costs, increased risk of inventory obsolescence, and potential cash flow issues due to capital being tied up in unsold inventory.
Strategies to Apply For Your Brand
- Assessing Inventory Operations Efficiency: The inventory turnover ratio helps brands determine how efficiently they are managing their inventory. With Prediko, a typical Shopify brand is able to save 20 hours/week on inventory operations & management.
In addition to turnover, understanding Calculating Days on Hand Inventory is crucial for managing stock effectively.
- Optimizing Stock Levels: By analyzing and interpreting inventory turnover, brands can make informed decisions about how much stock to keep on hand. This can help prevent overstocking, which ties up capital and increases storage costs, or understocking, which can lead to missed sales opportunities.
- Product Performance Analysis: The inventory turnover ratio can be calculated for individual products or product categories to understand the performance of a product. At Prediko, our buying table does that exactly for your brand.
Understanding and optimizing inventory turnover leads to more efficient stock management and improved cash flow for your Shopify D2C brand.